Agreement No. CE69/2015 (CE)
Tung Chung New Town Extension (East) – Design and Construction
Eco-shoreline Implementation Plan (Rev. A)
______________________________________
June 2023

|
Revision Number |
Date of Report |
Amendment |
|
- |
Sep 2020 |
First submission |
|
A |
Jun 2023 |
Section 1.2.2 updated Section 1.1.3 updated Section 2.1.1 updated Diagram 2.1 updated Section 2.2.2 updated Diagram 2.2 updated Section 3.1.4 updated Diagram 3.1 updated Section 6.1.2 updated Table 6.1 to 6.4 updated Diagram 6.2 updated Section 6.3 updated Diagram 6.3 updated Section 6.3.4 updated Section 6.4.1 updated Section 6.4.2 updated Section 6.4.3 updated Section 6.5.1 updated Section 6.5.4 added Section 6.6 added Appendix A updated Appendix B updated |
TABLE OF CONTENTS
4. IMPLEMENTATION PROGRAMME 13
5. DETAILED MANAGEMENT ARRANGMENTS 13
5.2 Mangrove and Rocky Eco-shoreline 13
6. MONITORING PROGRAMME WITH INDICATORS FOR SUCCESS 14
6.3 Monitoring Methodologies 17
APPENDICES
Appendix A – Implementation Programme for Eco-shoreline
Appendix B – Environmental Mitigation Implementation Schedule – Eco-shoreline Implementation Plan
1.1.1 AECOM Asia Co Ltd has been commissioned by the Civil Engineering and Development Department (CEDD) to undertake Agreement No. CE 69/2015 (CE) – Tung Chung New Town Extension (East) – Design and Construction. The Agreement commenced on 16 June 2016 and is scheduled to be completed in June 2027.
1.1.2 The reclamation, site formation, engineering infrastructure and associated works to support developments of both Tung Chung East (TCE) and Tung Chung West (TCW) are funded by PWP Item "7786CL - Tung Chung New Town Extension". The Technical Feasibility Statement for 7786CL was approved in September 2014. 7786CL is to be delivered by two consultancy agreements namely, Tung Chung New Town Extension (East) - Design and Construction (this Assignment) and Tung Chung New Town Extension (West) - Design and Construction (Agreement No. CE 70/2015(CE)).
1.1.3 The Project of this Assignment (the Project) includes reclamation, site formation and engineering infrastructure works (including construction of Road P1) for the developments of TCE, provision of salt water supply to Tung Chung New Town (TCNT) and Siu Ho Wan (SHW) topside and infrastructure works in Tung Chung Area 58 in the existing TCNT. The scope of the Project comprises the following principal works components:
a) Works in TCE
(i) Reclamation of about 120 hectares of seabed abutting the coastal area between Tung Chung Phase 3A and Tai Ho Bay Inlet and associated site formation works for the proposed developments;
(ii) Engineering infrastructure works including roads, drainage, sewerage including sewage pumping stations, and waterworks to support the proposed developments;
(iii) Provision of a marina;
(iv) Construction of a salt water pumping station for flushing use in TCNT, TCE, TCW and SHW topside;
(v) Landscaping, streetscaping and ancillary works; and
(vi) Provision of environmental mitigation measures for the works mentioned in (i) to (v) above;
b) Works in the existing TCNT or SHW
(i) Construction of a Fresh Water Service Reservoir (FWSR) near Chek Lap Kok New Village or at Siu Ho Wan for TCE and TCW;
(ii) Construction of a Salt Water Service Reservoir (SWSR) near Chek Lap Kok New Village for flushing use in TCNT, TCE, TCW and SHW topside;
(iii) Site formation works including natural terrain hazards mitigation measures for the works mentioned in (i) and (ii) above;
(iv) Waterworks for salt water supply for toilet flushing in SHW topside; and
(v) Engineering infrastructure works including roads, drainage, sewerage and waterworks to support the land allocation at Area 58 of the existing TCNT.
c) Works related to Road P1
(i) Reclamation of about 9 hectares of seabed for Road P1 (section between TCE and Tai Ho);
(ii) Construction of Road P1 with cycle track (section between TCE and Tai Ho) and associated engineering infrastructure works including drainage, sewerage and waterworks;
(iii) Site formation works for a cycle park of about 2 hectares near Tai Ho Interchange;
(iv) Improvement works to existing Tung Chung Waterfront Road and Ying Hei Road, including construction of noise barriers and footbridges, resurfacing of road pavement, etc., for upgrading them to a primary distributor as part of Road P1;
(v) Construction of an elevated interchange near Tai Ho connecting Road P1 to North Lantau Highway and Cheung Tung Road (Tai Ho Interchange);
(vi) Landscaping, streetscaping works and ancillary works; and
(vii) Provision of environmental mitigation measures for the works mentioned in (i) to (vi) above.
1.1.4 Recognising the limited ecological value of standard artificial seawall design, the Project Environmental Impact Assessment (EIA) Report (CEDD, 2015) recommended that ecological enhancement measures are considered in the seawall design for the TCE Potential Development Area (PDA) and Road P1 (Tung Chung - Tai Ho Section) Extension reclamation. This would provide mitigation for marine ecological impacts resulting from the Project, which include the permanent loss of 145 ha of marine waters/seabed (considered a minor to moderate scale impact, Diagram 1.1). Ecologically enhanced seawalls could partially compensate this impact by providing habitat for intertidal and subtidal marine communities.
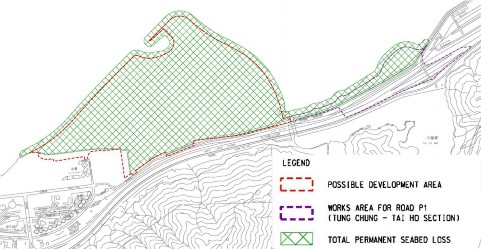
Diagram 1.1 – Extent of Permanent Seabed Habitat Loss (CEDD, 2015)
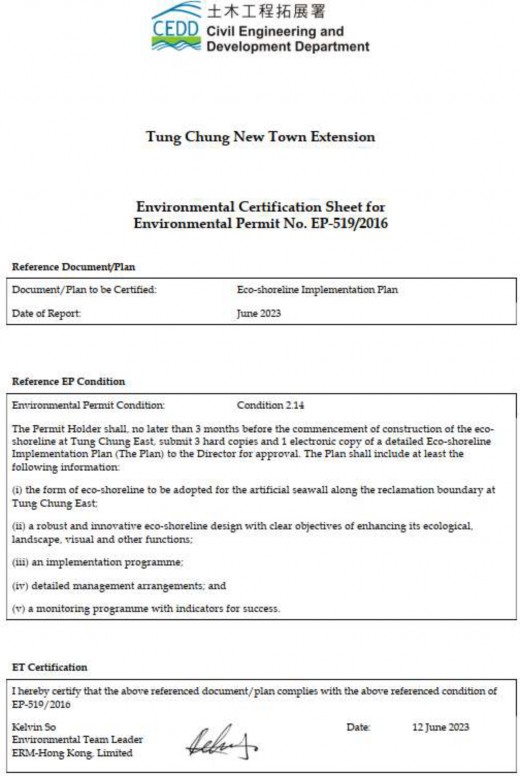
1.2.1. Pursuant to the Project Environmental Permit (Permit No. EP-519/2016) Condition 2.14, the Permit Holder shall, no later than 3 months before the commencement of construction of the eco-shoreline at Tung Chung East, submit 3 hard copies and 1 electronic copy of a detailed Eco-shoreline Implementation Plan (The Plan) to the Director of Environmental Protection for approval. The Plan shall include at least the following information:
(i) the form of eco-shoreline to be adopted for the artificial seawall along the reclamation boundary at Tung Chung East;
(ii) a robust and innovative eco-shoreline design with clear objectives of enhancing its ecological, landscape, visual and other functions;
(iii) an implementation programme;
(iv) detailed management arrangements; and
(v) a monitoring programme with indicators for success.
1.2.2. The eco-shoreline design for TCE comprises three typologies (rocky, mangrove and vertical). Construction of these typologies commenced as follows:
2.1.1 Section 9.8.4.3 of the EIA Report defines an eco-shoreline as ‘any shoreline which provides beneficial functions to the local ecosystems through a range of active or passive solutions, whilst providing coastal protection’. Section 9.8.4.4 of the EIA Report recommends that a study should be conducted to investigate the proper form of eco-shoreline to be adopted for the artificial seawall along the reclamation. During the detailed design of the reclamation, an eco-shoreline study report was submitted and three basic options for eco-shoreline design, namely mangrove eco-shoreline, rocky eco-shoreline and vertical eco-shoreline, were recommended for the TCE Potential Development Area (PDA) and Road P1 (Tung Chung - Tai Ho Section) Extension reclamation. The distribution of eco-shoreline is as shown in Diagram 2.1.
2.1.2 Eco-shoreline is to provide ecological functions to mitigate the loss of general marine habitat, while the function of coastal and shoreline protection should be provided by seawall structure. Elements of eco-shoreline such as mangroves, mudflat, oyster basket and bio-blocks will be installed/planted on top of seawall structure. The seawall structure was designed in accordance with Port Works Design Manual.
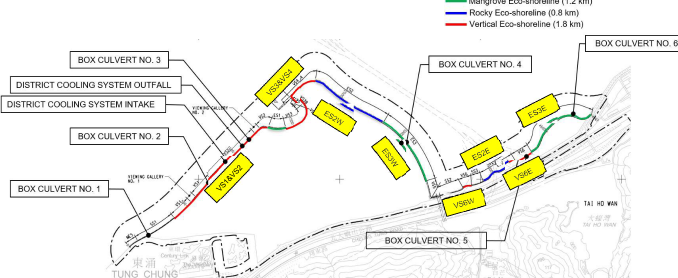
Diagram 2.1 – Layout Plan for Eco-shoreline
Note: Location of box culverts, District Cooling System outfall and intake are indicative
2.2.1 The mangrove eco-shoreline comprises of mudflats, mangroves and oyster baskets which highlighted in green and blue shown in the Diagram 2.2.
2.2.2 The sediment and nutrient rich, low salinity waters of Tung Chung support extensive soft-shore communities such as mangrove, mudflats and sandy beaches, where suitably sheltered shorelines occur. These communities tend to be more productive and diverse than hard shorelines in the area. Mudflats would be sourced locally within the Pearl River Estuary region and would be agreed by the Project Manager, ET and IEC before informing EPD.
2.2.3 The mangrove eco-shoreline design is proposed for the Road P1 (Tung Chung – Tai Ho Section), and the majority of the eastern coast of the TCE PDA, as well as an area on the western side of the marina. The typical arrangement of the proposed design is shown in Diagram 2.2, which incorporates mangrove and mudflat habitat into the shoreline.
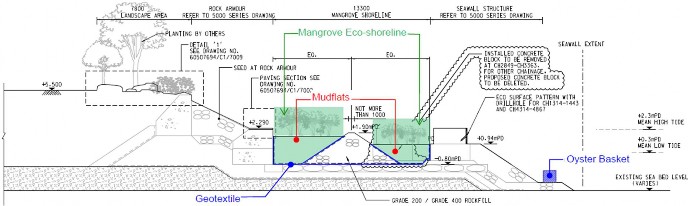
Diagram 2.2 – Typical Section of Mangrove Eco-shoreline
2.3.1 Rocky eco-shoreline comprises of bio-blocks and oyster basket which highlighted in blue shown in the Diagram 2.3.
2.3.2 Although hard-shoreline habitats are likely to support a lower abundance and diversity of intertidal fauna and flora than soft-shoreline habitats, they provide habitats that support different community types not associated with the mangrove and mudflats, particularly epifaunal species such as rock oysters (Saccostrea cucullata), limpets (e.g. Cellana sp.), barnacles (e.g. Balanus sp.), whelks (e.g. Thais sp.) mussels (e.g. Perna viridis), nerites (Nerita spp.) and littorinid gastropods (e.g. Littoraria sp. and Echinolittorina sp.). Furthermore, they can also add visual interest to the shoreline design. For these reasons, rocky eco-shoreline has been included in the eco-shoreline plan for the Project.
2.3.3 The rocky eco-shoreline design is proposed for the north-eastern coast of the TCE PDA. This location has been selected as it is the most exposed section of coastline to be constructed under the project, therefore environmental conditions would naturally favour hard shoreline in this area. A typical section of the proposed design is shown in Diagram 2.3, which incorporates a band of rocky habitat into the shoreline.
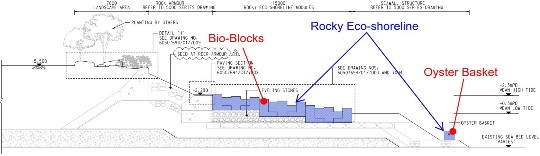
Diagram 2.3 – Typical Section of Rocky Eco-shoreline
2.4.1 Vertical eco-shoreline comprises of eco-pattern, eco-drillhole, eco-pot and bird resting area which highlighted in orange shown in the Diagram 2.4.
2.4.2 Standard vertical seawalls have a structurally simple, narrow intertidal zone of very limited ecological value. However, even these habitats can be enhanced to some degree by increasing surface complexity.
2.4.3 The vertical eco-shoreline design will be implemented on the western coast of the TCE PDA, as well as the vertical seawall on the eastern coast of the TCE PDA. A typical section of the design is shown in Diagram 2.4.

Diagram 2.4 – Typical Section of Vertical Eco-shoreline
Design Concept
3.1.1 The concept for the Mangrove Eco-shoreline is based on the wetland sill design, where a sill is constructed to provide a sheltered platform suitable for the establishment and growth of mangroves. The platform needs to be protected from wave action (which could lead to the scouring and loss of fine sediments from mudflats), while at the same time allowing tidal exchange required for mangrove growth and the movement of marine wildlife (e.g., marine larvae and fishes) in and out of the eco-shoreline area. The design would achieve this by using concrete blocks at the seaward edge of the eco-shoreline platform. Tidal exchange and the movement of wildlife through the sill will be facilitated by staggering the sill at approximately 30m intervals (Diagram 3.1). Some limited additional tidal exchange would occur through the base of the platform, where a geotextile fabric would allow water exchange while preventing the loss of fine sediments from mudflats.
Diagram 3.1 – Design of Mangrove Eco-shoreline
3.1.2 Mangroves can grow in a variety of mudflats, from fine silts through to relatively coarse sand. While suitable mudflats for mangrove growth would likely accumulate naturally over time, the rate of accretion would be very slow. Artificial filling of the platform is therefore required. The mudflats (approximately 2m thick) should be graded to be at just below high tide (+2.29 mPD) at the landward side of the platform, down to mean low tide (+0.29 mPD) at the seaward side (Diagram 2.2). This would create a range of potential mangrove and mudflats habitats.
3.1.3 Mangroves grow relatively poorly in pure saltwater: higher growth rates are achieved in brackish waters with lower salinity. While salinity levels in the TCE are thought to be within the range found at naturally occurring mangrove stands in Hong Kong, additional freshwater input to mangrove eco-shoreline can be provided by directing stormwater run-off from the promenade area landward of the eco-shoreline directly into the mangrove area.
Planting
3.1.4 To speed up the establishment of the eco-shoreline, mangroves will be planted in the platform. Only mangrove species native to Hong Kong and common in the existing Tung Chung area will be utilised. Mangrove planting considers the following elements:
- Size: Experience from overseas (Hoang, V.T., and Pham, T.T. (2010), Management of Natural Resources in the Coastal Zone of Soc Trang Province: Mangrove Nursery Manual. GTZ: 44p ) suggests around 325m2 flat area is needed to grow 10,000 seedlings per year (allowing for 20% mortality), together with 100-200m2 general working area.
- Water Supply: mangrove seeds and seedlings need require daily watering, so an adequate water supply is needed. Although brackish or salt water can be used, germination success and growth rates for most species are much higher if freshwater is used
- Drainage: adequate drainage is required to prevent flooding and washing out of seeds/seedlings.
Viewing of Eco-shoreline
3.1.5 The public will be able to view the mangrove and mudflat habitat from the promenade constructed landward of the eco-shoreline.
3.1.6 Information signage will be provided to inform the public about the development of the eco-shoreline and the flora and fauna found in the eco-shoreline habitats. Appropriate signage will be provided to warn the public about potential hazards in the eco-shoreline area.
Design Concept
3.2.1 The basic concept for the rocky eco-shoreline adopts rectangular shaped concrete blocks arranged to provide a natural looking shoreline. Concrete blocks were adopted for the following reasons:
3.2.2 The section shown in Diagram 3.2 has been designed with a low gradient to maximise the intertidal area of the rocky shoreline, increasing the number of niches available for intertidal organisms. The block-size is approximately 1 m3. By positioning some of the seaward blocks at a higher level than adjacent landward blocks, rock pools will be formed at low-tide that can provide a refuge for intertidal organisms (Diagram 3.3). Furthermore, holes, ledges and other surface structures will be cast into the blocks to further increase habitat value. It is important to create rockpools at different tidal levels to maximise species diversity; some habitat-specialist species are tidal-height specific, while other species require different tidal height pools throughout their life-cycle. To enhance the performance of bio-blocks to serve as the habitat for inter-tidal organism, the pH value of bio-block is also designed to be pH 9- 10, which is less alkaline than the ordinary concrete of around pH13.
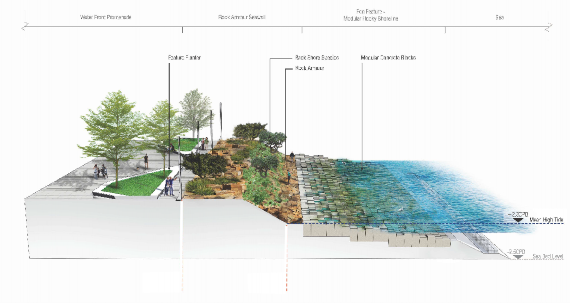
Diagram 3.2 – Design of Rocky Eco-shoreline

Diagram 3.3 – Detail of Bio-Block with Configuration and Micro-pools to Create Rockpools
Viewing of Eco-shoreline
3.2.3 The public will be able to view the rocky eco-shoreline from the promenade constructed landward of the eco-shoreline (labelled as water front promenade in Diagram 3.2).
3.2.4 It is recognised that the lower shore would be colonised by algae (making surfaces slippery) and rock oysters (which have sharp shells) posing a potential hazard to the public. Appropriate signage will be provided to warn the public about potential hazards in the eco-shoreline area.
3.2.5 Information signage will be provided to inform the public about the development of the eco-shoreline and the flora and fauna found in the eco-shoreline habitats.
Design Concept
3.3.1 The basic concept for the vertical eco-shoreline is to provide surface treatment to block-work used to form the sea-wall.
3.3.2 Additional enhancement features included in the vertical seawall design comprise:
Public Information
3.3.3 Information signage will be provided to inform the public about the development of the eco-shoreline and the flora and fauna found in the eco-shoreline habitats. Appropriate signage will be provided to warn the public about potential hazards in the eco-shoreline area.
Introduction
3.4.1 In addition to the three basic eco-shoreline typologies described in the previous sections, the project also presents other opportunities for ecological enhancement works. In the limited sub-tidal areas at the toe of proposed eco-shorelines, oyster baskets filled with oyster shells are deployed to increase habitat complexity and enhance ecosystem function and services.
3.4.2 For rocky and mangrove eco-shoreline, there will be a small platform (2-3m wide) at the toe of the seawall below average low tide level for deployment of oyster baskets as indicated in Diagrams 2.2 and 2.3. Examples of typical oyster basket design are shown in Diagram 3.4.
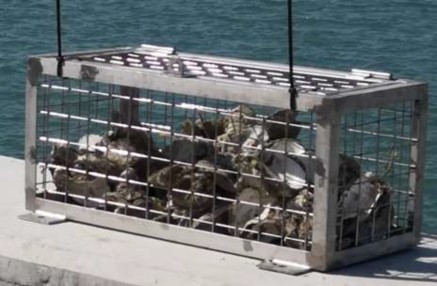
Diagram 3.4 – Oyster Basket filled with Oyster Shells
3.4.3 For the current project, oyster baskets with the following characteristics will be deployed:
4.1.1 The programme for implementation of the eco-shoreline is outlined in Appendix A.
5. DETAILED MANAGEMENT ARRANGMENTS
5.1.1 The maintenance agents of vertical eco-shoreline are summarised in Table 5.1. The eco-features are installed on the vertical surface of the vertical seawall as shown in Diagram 2.4. The eco-features are part of the vertical seawall. There is no specific management issue for these eco-features
|
Item |
Description |
Maintenance Agent |
|
1 |
Eco-features, including bird resting area, eco-surface pattern, eco-drillhole and eco-pot |
Port Works Division/ CEDD |
Table 5.1 – Maintenance Agents of Vertical Eco-shoreline
5.2 Mangrove and Rocky Eco-shoreline
5.2.1 The maintenance agents for mangrove and rocky eco-shoreline is summarized in Table 5.2. The eco-features are installed on the surface of the slopping seawall as shown in Diagram 2.2 and 2.3. The eco-features are part of the slopping seawall. There is no specific management issue for these eco-features.
|
Item |
Description |
Maintenance Agent |
|
1 |
Planter for Mangrove |
Port Works Division/ CEDD |
|
2 |
Planter for Bio-blocks |
Port Works Division/ CEDD |
|
3 |
Oyster Basket |
Port Works Division/ CEDD |
Table 5.2 – Maintenance Agents of Mangrove and Rocky Eco-shoreline
6. MONITORING PROGRAMME WITH INDICATORS FOR SUCCESS
6.1.1. Section 9.11.2.2 of the Project EIA Report outlines eco-shoreline monitoring requirements: The colonisation and establishment of fauna and/or flora on the eco- shoreline at TCE PDA and Road P1 reclamation should be monitored. The monitoring survey should include quantitative ecological survey methods and measurements of water quality parameters, and cover dry and wet seasons. As it is expected that this measure will also benefit fisheries species in the marine ecosystems, besides ecological components, the monitoring should also include monitoring on fisheries resources (in particular the recruitments of fisheries species).
6.1.2 Section 11.4.6 of the updated EM&A Manual further details eco-shoreline monitoring requirements, which are reproduced here for ease of reference:
(Remarks: The monitoring works will be conducted by the Monitoring Team employed by CEDD. Based on the actual works programme, the eco-shoreline monitoring shall be conducted for at least 3 years after completion of eco-shoreline. The updated monitoring programme is presented in Section 6.4.)
6.1.3 Based on these specifications, monitoring locations, methodologies and programme have been developed.
6.2.1 Eco-shoreline Monitoring locations are shown in Diagram 6.1.
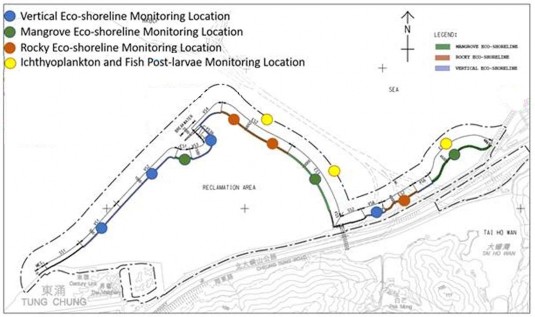
Diagram 6.1 – Eco-shoreline Monitoring Locations
6.2.2 Reference monitoring locations are shown in Diagram 6.2. Locations R2 and R3 were selected along typical sloping rip-rap shoreline close to the proposed eco-shoreline (presumably with similar environmental conditions). Location R1 is a typical vertical shoreline with no enhancement features. An additional fish sampling location (R4) is included at Tung Chung Bay to compare the species abundance at a natural mangrove site. Representative photographs of the reference locations are provided in Diagram 6.3
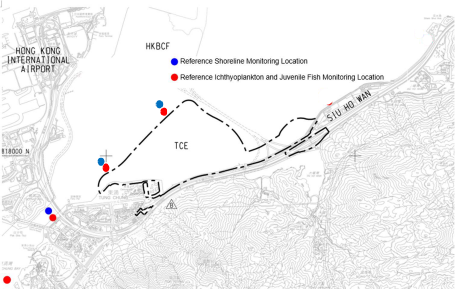
Diagram 6.2 – Proposed Reference Monitoring Locations
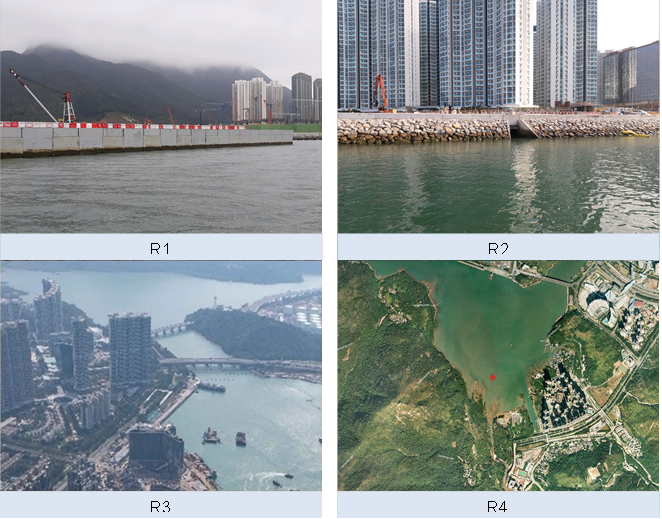
Diagram 6.3 – Photos of Proposed Reference Monitoring Locations
Mangrove Eco-shoreline
6.3.1 Mangrove eco-shoreline monitoring methodology at each survey location is described in Table 6.1. Mangrove eco-shoreline Monitoring locations (3 numbers) are shown in Diagram 6.1
Table 6.1 – Mangrove Eco-shoreline Monitoring Methodology
|
Parameter |
Methodology |
No. of Sample at each monitoring location |
Details |
Frequency |
|
Avifauna |
Point count |
1 |
Single point count undertaken at each sampling point. Surveys undertaken for a period of 15min covering all visible areas (i.e., 360º) at a radius of 100m from the survey point. Record made of avifauna species richness and abundance in different habitats (i.e., mangrove, mudflat, open water, seawall, landscape promenade) as well as any notable behaviour (hunting, roosting, nesting). |
To be monitored at low tide, twice in wet season and twice in dry season, at least 3 years |
|
Epifauna |
Transect |
3 |
1m2 quadrat surveyed at three points (high, medium and low shore) along each transect. Species richness and abundance/frequency recorded. Diversity index and evenness index should be calculated. |
To be monitored at low tide, twice in wet season and twice in dry season, at least 3 years |
|
Infauna |
Transect |
3 |
0.25m2 quadrat surveyed at three points (high, medium and low shore) along each transect. The top 0.1m mudlfat layer within the quadrat will be collected and screened through 0.5mm mesh size sieve. Fauna sorted will be identified and counted. |
To be monitored at low tide, twice in wet season and twice in dry season, at least 3 years |
|
Vegetation |
Transect |
3 |
2m2 quadrat surveyed at three points (high, medium and low shore) along each transect. The following information about each plant within the quadrat will be recorded: species, height, number of leaves and health (signs of chlorosis/necrosis). |
To be monitored at low tide, twice in wet season and twice in dry season, at least 3 years |
|
Fixed Point Sample |
3 |
General mangrove health (% mortality) at each location will be recorded, with fixed point photographs taken for easy comparison of mangrove health. |
||
|
Mudflat Properties |
Core Sample |
3 |
2-3cm diameter core sample taken at high, middle and low shore. Particle size, organic content, C, N, pH and salinity, should be measured. |
To be monitored at low tide, twice in wet season and twice in dry season, at least 3 years |
|
Mudflat Level |
Fixed gauge at seaward and landward side of the mangrove area |
3 |
Measure top level of mudflat. |
To be monitored at low tide, twice in wet season and twice in dry season, at least 3 years |
|
Water Quality |
Spot sample |
3 |
Dissolved oxygen (DO), dissolved oxygen saturation (DO%), temperature, turbidity, salinity, pH and suspended solids (SS), should be measured. |
To be monitored at low tide, twice in wet season and twice in dry season, at least 3 years |
Rocky Eco-shoreline
6.3.2 Rocky eco-shoreline monitoring methodology at each survey location is described in Table 6.2. Rocky eco-shoreline Monitoring locations (3 numbers) are shown in Diagram 6.1
Table 6.2 – Rocky Eco-shoreline Monitoring Methodology
|
Parameter |
Methodology |
No. of Sample at each monitoring location |
Details |
Frequency |
|
Avifauna |
Point count |
1 |
Single point count undertaken at each sampling point. Surveys undertaken for a period of 15min covering all visible areas (i.e., 360º) at a radius of 100m from the survey point. Record made of avifauna species richness and abundance in different habitats (i.e., mangrove, mudflat, open water, seawall, landscape promenade) as well as any notable behaviour (hunting, roosting, nesting). |
To be monitored at low tide, twice in wet season and twice in dry season, at least 3 years |
|
Epifauna |
Transect |
3 |
1m2 quadrat surveyed at three points (high, medium and low shore) along each transect. Species richness and abundance/frequency recorded. Diversity index and evenness index should be calculated. |
To be monitored at low tide, twice in wet season and twice in dry season, at least 3 years |
|
Water Quality |
Spot sample |
3 |
Dissolved oxygen (DO), dissolved oxygen saturation (DO%), temperature, turbidity, salinity, pH and suspended solids (SS), should be measured. |
To be monitored at low tide, twice in wet season and twice in dry season, at least 3 years |
Vertical Eco-shoreline
6.3.3 Vertical eco-shoreline monitoring methodology at each survey location is described in Table 6.3. Vertical eco-shoreline Monitoring locations (4 numbers) are shown in Diagram 6.1
Table 6.3 – Vertical Eco-shoreline Monitoring Methodology
|
Parameter |
Methodology |
No. of Sample at each monitoring location |
Details |
Frequency |
|
Avifauna |
Point count |
1 |
Single point count undertaken at each sampling point. Surveys undertaken for a period of 15min covering all visible areas (i.e., 360º) at a radius of 100m from the survey point. Record made of avifauna species richness and abundance in different habitats (i.e., mangrove, mudflat, open water, seawall, landscape promenade) as well as any notable behaviour (hunting, roosting, nesting). |
To be monitored at low tide, twice in wet season and twice in dry season, at least 3 years |
|
Epifauna |
Transect |
3 |
1m2 quadrat surveyed at three points (high, medium and low shore) along each transect. Species richness and abundance/frequency recorded. Diversity index and evenness index should be calculated. |
To be monitored at low tide, twice in wet season and twice in dry season, at least 3 years |
|
Water Quality |
Spot sample |
3 |
Dissolved oxygen (DO), dissolved oxygen saturation (DO%), temperature, turbidity, salinity, pH and suspended solids (SS), should be measured. |
To be monitored at low tide, twice in wet season and twice in dry season, at least 3 years |
Ichthyoplankton and Juvenile Fish Monitoring
6.3.4 Ichthyoplankton and juvenile fish monitoring methodology at each survey location is described in Table 6.4. Ichthyoplankton and juvenile fish monitoring locations (3 numbers) are shown in Diagram 6.1
Table 6.4 – Ichthyoplankton and Juvenile Fish Monitoring Methodology
|
Parameter |
Methodology |
No. of Sample at each monitoring location |
Details |
Frequency |
|
Ichthyoplankton |
Plankton net |
1 |
Sampling undertaken with one pair of bongo net with 0.5mm mesh size, towed at a speed of around 1 - 2 knots against the flow for 10 minutes. The mouth of one of the nets should be fitted with a flowmeter to record the volume of water filtered and allow calculation of ichthyoplankton density (i.e., number of fish per 100m³ of water filtered). Samples to be sorted in the laboratory, with all fish larvae to be identified and counted, and diversity/ eveness should be calculated. A minimum of three replicates shall be performed for sampling ichthyoplankton each time at each sampling locations for collection of representative data. Should vessels be used for the sampling, the Fisheries Protection Ordinance (Cap. 171) shall be observed and relevant permits applied for as necessary. |
To be monitored on a monthly basis covering May to August, at least 3 years |
|
Juvenile Fish |
Purse Seine |
3 |
Sampling undertaken with mesh size of 6mm for purse seine and 12- 16mm for cage traps:
The catches were identified to species level as far as practicable and the species composition, abundance, size and biomass in weight were measured, and diversity/ evenness should be calculated. Should vessels be used for the sampling, the Fisheries Protection Ordinance (Cap. 171) shall be observed and relevant permits applied for as necessary. |
To be monitored on a monthly basis covering May to August, at least 3 years |
Reference Site Monitoring
6.3.5 Reference monitoring should be undertaken using the same methodologies adopted for Mangrove Eco-shoreline (Table 6.1), Rocky Eco-shoreline Monitoring (Table 6.2),Vertical Eco-shoreline (Table 6.3) and Ichthyoplankton and Juvenile Fish Monitoring (Table 6.4). Reference monitoring locations are shown in Diagram 6.2.
6.4.1 Eco-shoreline is scheduled to be completed by 2023 Q2. Monitoring shall be conducted for at least 3 years after the completion of the eco-shoreline. The monitoring works will commence as follows:
Mangrove, Rocky and Vertical Eco-shoreline
6.4.2 Each year every point (including reference point) shall be monitored at low tide, twice in the wet season and twice in the dry season for at least 3 years. The need of extension of monitoring will be reviewed upon completion of monitoring and subject to the findings of monitoring surveys.
Ichthyoplankton and Juvenile Fish Monitoring
6.4.3 Each year every point (including reference point) shall be monitored during the spawning periods of marine fishes. The monitoring will be carried out on a monthly basis covering May to August for at least 3 years. The need of extension of monitoring will be reviewed upon completion of monitoring and subject to the findings of monitoring surveys.
6.5.1 The progress reports should be prepared in half-year basis for outlining monitoring activities undertaken during the reporting period, summarizing monitoring results (including any key findings), and summarizing works to be undertaken in the next monitoring period.
6.5.2 During the monitoring period, an annual report should be prepared that includes the following:
6.5.3 A final report should be produced at the end of the monitoring period detailing all of the monitoring results, conclusion and recommendation.
6.5.4 Monitoring findings during the monitoring period will be reported and presented in Monthly EM&A Reports. Progress reports, annual reports and final report will be submitted to AFCD and EPD with ET’s certifications and IEC’s verifications.
6.6.1 Indicators of success as described below should assessed on a yearly basis for each of the monitoring locations shown in Diagram 6.1. This assessment should be included in the Annual Report.
Community Indicators for Success
6.6.2 Community indicators for success for the eco-shoreline include:
Specific Indicators for Success
6.6.3 Specific indicators for success of each eco-shoreline typology have been developed based on monitoring data collected from the Siu Ho Wan (SHW) Trial Site, as well as established vertical eco-shoreline (with ecological enhancement elements including holes and ridges) along the northern shore of the Tung Chung East (TCE) Project Site. This data has been reviewed and potential indicators for success identified, as described below.
6.6.4 Epifaunal transect surveys of the SHW trial mangrove eco-shoreline, showed that the crustacean Amphibalanus amphitrite was recorded in 9 of 12 surveys in the 2nd year of establishment, with at least 1% coverage per m2 recorded. Worm Polychaeta spp. and crustacean Macrophthalmidae spp. were recorded in over 3 of 6 surveys in each wet and dry seasons in the 2nd year of establishment. During the wet season, crustacean Uca (Tubuca) spp. was occasionally recorded in the 2nd year of establishment.
6.6.5 For the mangrove species in SHW Trial Site, the survivorship of Avicennia marina and Kandelia obovata were significantly better than the other mangrove plants (such as Lumnitzera racemose and Aegiceras corniculatum), which the highest survival rate was 70% after the 1st year of establishment. Over 60 % of Kandelia obovata and
Avicennia marina were recorded with leaves after the 1st year of establishment. The average height of Kandelia obovata increased by 20% and more than 60% in the 1st and 2nd year of establishment respectively, while Avicennia marina increased by 36% and 40%. No data on flowering or fruiting of mangroves was recorded in the SHW Monitoring Report, but casual observations from the site indicate that some individuals of both Avicennia marina and Kandelia obovata bore flowers and fruits after the 2nd year of establishment. The presence of flowers and/or fruits on mangrove plants within the eco-shoreline could also therefore be an indicator that the community is moving towards becoming self-sustaining.
6.6.6 Epifaunal transect surveys of SHW trial rocky eco-shoreline and the TCE sloping seawall site recorded common species such as bivalves Saccostrea cucullata, crustacean Amphibalanus Amphitrite, gastropods Monodonta labio and Reishia clavigera at both sites since the 1st year of establishment. However, some other species were only recorded at the SHW trial rocky eco-shoreline such as crustacean Metopograpsus sp., gastropods Littoraria articulata and Nipponacmea sp. Crustacean Metopograpsus sp. was recorded intermittently in both wet and dry seasons. More records of Metopograpsus sp. with higher than 0.1 individual per m2 were recorded in the 2nd year of establishment. In addition, gastropods Littoraria articulata Monodonta labio, Reishia clavigera and Nipponacmea sp. were recorded in the SHW Trial Site most months since the 1st year of establishment. More records of higher densities of Littoraria articulata, Monodonta labio and Reishia clavigera (more than 0.5 individual per m2) were recorded in the 2nd year of establishment. The presence of the aforementioned epifauna species could indicate the success of a rocky eco-shoreline.
6.6.7 The TCE vertical eco-shoreline supported bivalves Saccostrea cucullata, gastropods Littoraria articulata and crustaceans Metopograpsus sp. and Tetraclita squamosa. The presence of these epifaunal species can indicate the success of vertical eco- shoreline.
6.6.8 Based on the data outlined above, reference specific indicators of success for vertical, rocky and mangrove eco-shorelines have been identified and summarized in Table 6.5 below. As well as the target densities and occurrence indicated in Table 6.5, these indicators of success should also be compared with data from the reference sites. It is expected that these metrics would be higher at the eco-shoreline sites than the reference site after 2-3 years of establishment.
Table 6.5 Summary of Indicator of Success on Vertical, Rocky and Mangrove Eco-shorelines in Transect Surveys
|
Indicator of success |
1 year |
2 year |
3 year |
|||
|
Dry Season |
Wet Season |
Dry Season |
Wet Season |
Dry Season |
Wet Season |
|
|
Vertical Eco-shoreline (epifaunal surveys) |
Bivalves Saccostrea cucullata: =>1% coverage per m2 in at least one survey |
Bivalves Saccostrea cucullata: =>2% coverage per m2 |
Bivalves Saccostrea cucullata: =>5% coverage per m2 |
|||
|
Crustacean Tetraclita squamosa: =>1% coverage per m2 in at least one survey
Presence of Crustacean Metopograpsus sp. |
Crustacean Tetraclita squamosa: =>2% coverage per m2
Crustacean Metopograpsus sp.: =>1 individual per m2 |
Crustacean Tetraclita squamosa: =>5% coverage per m2
Crustacean Metopograpsus sp.: =>2 individuals per m2 |
||||
|
*Gastropod Littoraria articulata: =>1 individual per m2 in at least one survey |
*Gastropod Littoraria articulata: =>2 individuals per m2 |
*Gastropod Littoraria articulata: =>3 individuals per m2 |
||||
|
Rocky Eco-shoreline (epifaunal surveys) |
Gastropod Monodonta labio: =>1 individual per m2 in at least one survey
*Gastropod Littoraria articulata: =>1 individual per m2 in at least one survey
*Gastropod Nipponacmea sp.: => 1 individual per m2 in over 10% quadrats surveyed
Gastropod Reishia clavigera: =>1 individual per m2 in at least one survey per season |
Gastropod Monodonta labio: =>1 individual per m2
*Gastropod Littoraria articulata: =>2 individuals per m2
*Gastropod Nipponacmea sp.: =>1 individual per m2 in over 20% quadrats surveyed
Gastropod Reishia clavigera: =>1 individual per m2 |
Gastropod Monodonta labio: =>2 individuals per m2
*Gastropod Littoraria articulata: =>3 individuals per m2
*Gastropod Nipponacmea sp.: =>1 individual per m2 in over 40% quadrats surveyed
Gastropod Reishia clavigera: =>2 individuals per m2 |
|||
|
*Presence of Crustacean Metopograpsus sp. |
*Crustacean Metopograpsus sp.: =>1 individual per m2 in over 20% quadrats surveyed |
*Crustacean Metopograpsus sp.: => 1 individual per m2 in over 30% quadrats surveyed |
||||
|
Indicator of success |
1 year |
2 year |
3 year |
|||
|
Dry Season |
Wet Season |
Dry Season |
Wet Season |
Dry Season |
Wet Season |
|
|
Mangrove Eco-shoreline (epifaunal, infaunal and vegetation surveys) |
Maintain 70% survival rate of mangrove species Kandelia obovata and Avicennia marina respectively |
Maintain 70% survival rate of mangrove species Kandelia obovata and Avicennia marina respectively |
Maintain 70% survival rate of mangrove species Kandelia obovata and Avicennia marina respectively |
|||
|
/ |
/ |
Presence of flowers/fruit on Avicennia marina and Kandelia obovata |
||||
|
Maintain 60% Kandelia obovata and Avicennia marina with leaves |
Maintain 60% Kandelia obovata and Avicennia marina with leaves |
Maintain 60% Kandelia obovata and Avicennia marina with leaves |
||||
|
The average height of Kandelia obovata and Avicennia marina increase by more than 15% after 1 year |
The average height of Kandelia obovata and Avicennia marina increase by more than 20% after 2 years |
The average height of Kandelia obovata and Avicennia marina increase by more than 25% after 3 years |
||||
|
/ |
/ |
/ |
Crustacean Uca (Tubuca) spp.: =>1 individual per m2 recorded in over 20% quadrats surveyed |
/ |
Crustacean Uca (Tubuca) spp.: => 1 individual per m2 recorded in over 30% quadrats surveyed |
|
|
Crustacean Amphibalanus Amphitrite: => 1% coverage per m2 in at least one survey Presence of Crustacean Macrophthalmidae spp. |
Crustacean Amphibalanus Amphitrite: => 2% coverage per m2
Crustacean Macrophthalmidae spp.: => 1 individual per m2 in epi-fauna/in-fauna survey |
Crustacean Amphibalanus Amphitrite: => 5% coverage per m2
Crustacean Macrophthalmidae spp.: => 2 individuals per m2 in epi-fauna/in-fauna survey |
||||
|
Worm Polychaeta spp.: => 1 individual per m2 recorded in in-fauna survey in at least one survey |
Worm Polychaeta spp.: => 1 individual per m2 in in-fauna survey |
Worm Polychaeta spp.: => 2 individuals per m2 recorded in in-fauna survey |
||||
* Distinctive species identified from the Siu Ho Wan Site Trial, recorded at higher densities than from reference data collected from typical engineered shoreline.
**It should be noted that the species richness and density of the species indicators in the eco-shorelines might be similar to the reference site in the first 2-3 years of establishment. It is expected that the species richness and density in the eco-shoreline would be higher than the reference site after the establishment period of 2-3 years.
6.6.9 If the monitoring results of the eco-shoreline do not meet the indicators described in Table 6.5, the Monitoring Team (MT) should notify the CEDD, Environmental Team (ET), Independent Environmental Checker (IEC), Project Manager (PM) and Contractor. The MT should review the data as well as site conditions at the eco- shoreline survey site(s) to determine any potential reasons that the indicators of success have not been met. The MT should report the results of the investigation to CEDD, ET, IEC, PM and Contractor.
|
Locations of eco-shoreline |
Start |
Finish |
2021 |
2022 |
2023 |
||||||||||||||||||||||||
|
Oct |
Nov |
Dec |
Jan |
Feb |
Mar |
Apr |
May |
Jun |
Jul |
Aug |
Sep |
Oct |
Nov |
Dec |
Jan |
Feb |
Mar |
Apr |
May |
Jun |
Jul |
Aug |
Sep |
Oct |
Nov |
Dec |
|||
|
Mangrove Eco-shoreline |
|
|
|
|
|
|
|
|
|
|
|
|
|
|
|
|
|
|
|
|
|
|
|
|
|
|
|
|
|
|
ES1 |
Oct-22 |
Apr-23 |
|
|
|
|
|
|
|
|
|
|
|
|
|
|
|
|
|
|
|
|
|
|
|
|
|
|
|
|
|
|
|
|
|
|
|
|
|
|
|
|
|
|
|
|
|
|
|
|
|
|
|
|
|
|
|
|
|
|
|
ES3W |
Dec-21 |
Apr-23 |
|
|
|
|
|
|
|
|
|
|
|
|
|
|
|
|
|
|
|
|
|
|
|
|
|
|
|
|
|
|
|
|
|
|
|
|
|
|
|
|
|
|
|
|
|
|
|
|
|
|
|
|
|
|
|
|
|
|
|
ES3E |
May-22 |
Jun-23 |
|
|
|
|
|
|
|
|
|
|
|
|
|
|
|
|
|
|
|
|
|
|
|
|
|
|
|
|
|
|
|
|
|
|
|
|
|
|
|
|
|
|
|
|
|
|
|
|
|
|
|
|
|
|
|
|
|
|
|
Rocky Eco-shoreline |
|
|
|
|
|
|
|
|
|
|
|
|
|
|
|
|
|
|
|
|
|
|
|
|
|
|
|
|
|
|
ES2W |
Mar-22 |
Apr-23 |
|
|
|
|
|
|
|
|
|
|
|
|
|
|
|
|
|
|
|
|
|
|
|
|
|
|
|
|
|
|
|
|
|
|
|
|
|
|
|
|
|
|
|
|
|
|
|
|
|
|
|
|
|
|
|
|
|
|
|
ES2E |
Sep-22 |
Apr-23 |
|
|
|
|
|
|
|
|
|
|
|
|
|
|
|
|
|
|
|
|
|
|
|
|
|
|
|
|
|
|
|
|
|
|
|
|
|
|
|
|
|
|
|
|
|
|
|
|
|
|
|
|
|
|
|
|
|
|
|
Vertical Eco-shoreline |
|
|
|
|
|
|
|
|
|
|
|
|
|
|
|
|
|
|
|
|
|
|
|
|
|
|
|
|
|
|
VS1 & VS2 |
Apr-22 |
Dec-22 |
|
|
|
|
|
|
|
|
|
|
|
|
|
|
|
|
|
|
|
|
|
|
|
|
|
|
|
|
|
|
|
|
|
|
|
|
|
|
|
|
|
|
|
|
|
|
|
|
|
|
|
|
|
|
|
|
|
|
|
VS3 & VS4 |
Sep-22 |
Feb-23 |
|
|
|
|
|
|
|
|
|
|
|
|
|
|
|
|
|
|
|
|
|
|
|
|
|
|
|
|
|
|
|
|
|
|
|
|
|
|
|
|
|
|
|
|
|
|
|
|
|
|
|
|
|
|
|
|
|
|
|
VS6W |
Apr-22 |
Aug-22 |
|
|
|
|
|
|
|
|
|
|
|
|
|
|
|
|
|
|
|
|
|
|
|
|
|
|
|
|
|
|
|
|
|
|
|
|
|
|
|
|
|
|
|
|
|
|
|
|
|
|
|
|
|
|
|
|
|
|
|
VS6E |
Feb-22 |
Aug-22 |
|
|
|
|
|
|
|
|
|
|
|
|
|
|
|
|
|
|
|
|
|
|
|
|
|
|
|
Remarks:
Locations of eco-shoreline refer to Diagram 2.1
Environmental Mitigation Implementation Schedule – Eco-shoreline Implementation Plan
|
EIA Ref. |
EM&A Log Ref. |
Recommended Mitigation Measures |
Objectives of the Recommended Measures & Main Concerns to address |
Implementation Agent |
Location |
Implementation Stage |
Implementation Plan Ref. |
|
S9.8.4 |
EC14 |
Adopting Eco-shoreline design |
To mitigate the impact of the marine loss |
CEDD |
Along future seawall |
Construction phase |
Section 2 and section 3 |
|
S9.11.2 |
EC26 |
Eco-shoreline and ichthyoplankton and juvenile fish monitoring |
|
CEDD |
Eco-shoreline at TCE reclamation |
fish, post- construction/ operation phase, during the spawning periods of marine fishes, on a monthly basis covering May to August, at least 3 years, and subject to review on monitoring extension |
Section 6 |
|
S10.9 |
F5 |
Follow the mitigation measure of eco- shoreline in ecology chapter for the construction and operation phases of the project. |
To enhance the fisheries resources |
CEDD |
Eco- shorelines at TCE Reclamation |
Construction phase and operation phase |
Section 2, Section 3 and Section 6 |
|
S11.7 MM9 |
LV9 |
Providing Natural Rock Material/ Planting for Artificial Seawall – There would be inevitable permanent losses of marine waters (seabed and water column), and direct impacts on existing artificial seawalls due to the reclamation. To minimize the impacts, the design of the future seawall like ‘eco- shoreline’ could be improved to provide high ecological functions and mitigate the impact of the loss. An ‘eco-shoreline’ is any shoreline which provides beneficial functions to the local ecosystem through a range of active or passive solutions, whilst providing coastal protection. By means of using natural rock materials for artificial seawall and considering to introduce a native vegetation buffer directly behind the top of seawalls as appropriate to create habitat, shelter and a source of food for benefiting both terrestrial and aquatic species along the foreshore, these measures can help to enhance the ecological functions and ‘natural-look’ of the shoreline, and the potential impacts will be mitigated. |
Mitigate the impacts on existing artificial seawalls |
CEDD |
Along future seawall |
Construction Phase and Operation Phase |
Section 2, Section 3 and Section 6 |